Comprehensive Beginners’ guide for understanding the data published on @BtcInOutAlert and t.me/BtcInOutAlert What is Netflow
The netflow is the Net or Average value that represents the difference between Bitcoin inbound and outbound from/to SPOT exchanges : Inflow – Outflow = Netflow
CAUTION: We talk about statistical PROBABILITY at regular times, not certainty. Each movement must be in context and interpreted by the user in a larger context.
It is essential to remember that every data evaluation must always be contextualized to the graphic situation (of Btc), therefore it is advisable to use Netflow not as a single tool for predicting the price, but rather as a support to confirm or deny a trend.
Our role is not to provide predictive data. No data contained on our website is indicates price predictions. No value contained on this site should be considered investment advice. Cryptos are highly volatile and high risk, so the user assumes all sole ultimate responsibility for decision-making in the market.
BtcInOutAlert provides netflow data, not price forecasts or financial advice.
Report
The Report is a summary of #NETFLOW data in real time.
It is divided by timeframe, and the values are highlighted in a more or less intense red or green color to facilitate reading.
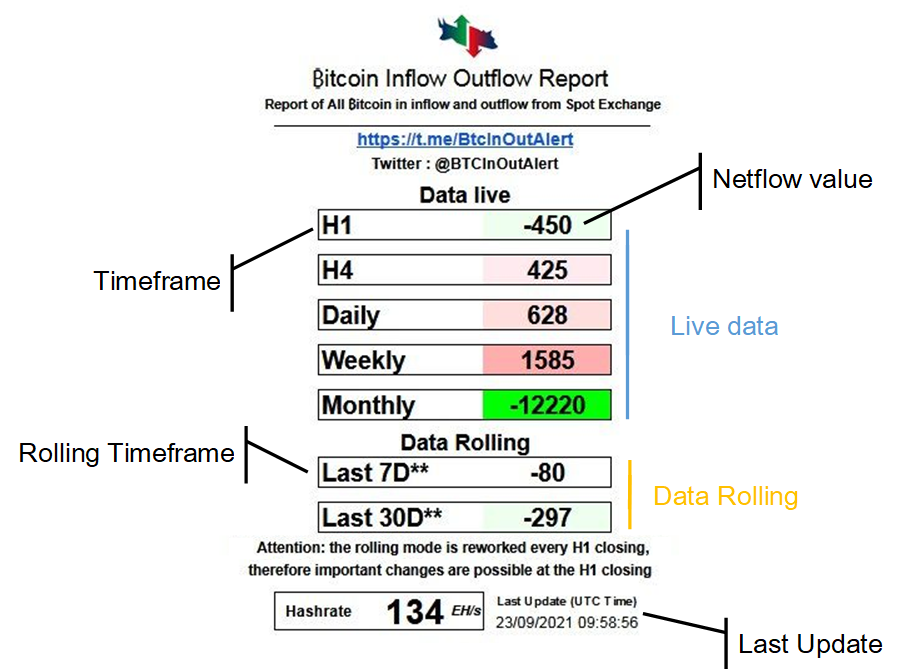
Live values :
H1 is the current hourly total netflow (As the data is live, H1 = netflow calculated from the start of the current hour until the present moment. E.g. if it is 12.41, the value of the netflow accounts for all movements happened between 12:00 and 12:41.)
This also applies to Live Data for H4, Daily and Monthly.
Rolling values :
Rolling data value are continuously updated with the following logic:
- Last 7D is the sum of: Latest Daily netflow values + previous 6 Daily netflow values
- Last 30D is the sum of: Latest Daily netflow value + previous 29 Daily netflow values
Charts
Charts are a graphical representation of the netflow movements. They are published on different timeframes, net or averaged.
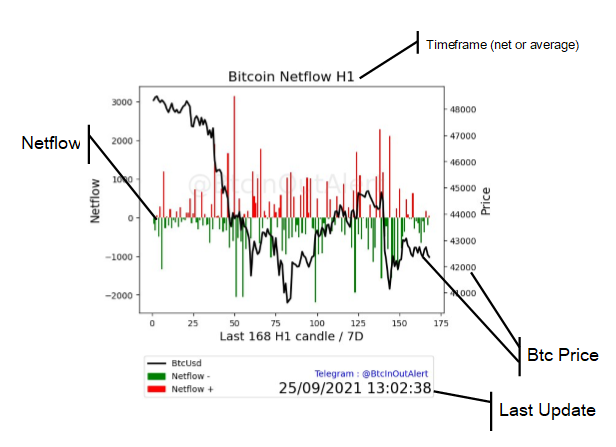
Net flow can be useful in analysis, if done on different timeframes it can provide significant insights into analysis. On low timeframes it can help to understand short-term action, while on longer timeframes it can have a medium- to long-term effect.
How to use Netflow
Interpretation of the netflow allows analysis of trends to and from the exchanges