
[adinserter name=”CoinAdsenseRotation”]
[adinserter name=”CoinAdsenseRotationMobile”]
Intro
Onchain data are becoming increasingly important in the Bitcoin world, this is because they are useful in interpreting and often anticipating Bitcoin price movements. We have noticed how there is an openness even from major Exchanges in publishing onchain data (Kraken for example publishes excellent analysis, find the link at the bottom of the page of their analysis).
There are many useful onchain indicators, but today we will focus on Netflow, which is the most natural movement of bitcoin to exchanges, and bitcoin in exchanges are the ones that generate the price for an ordinary person.
What is Netflow
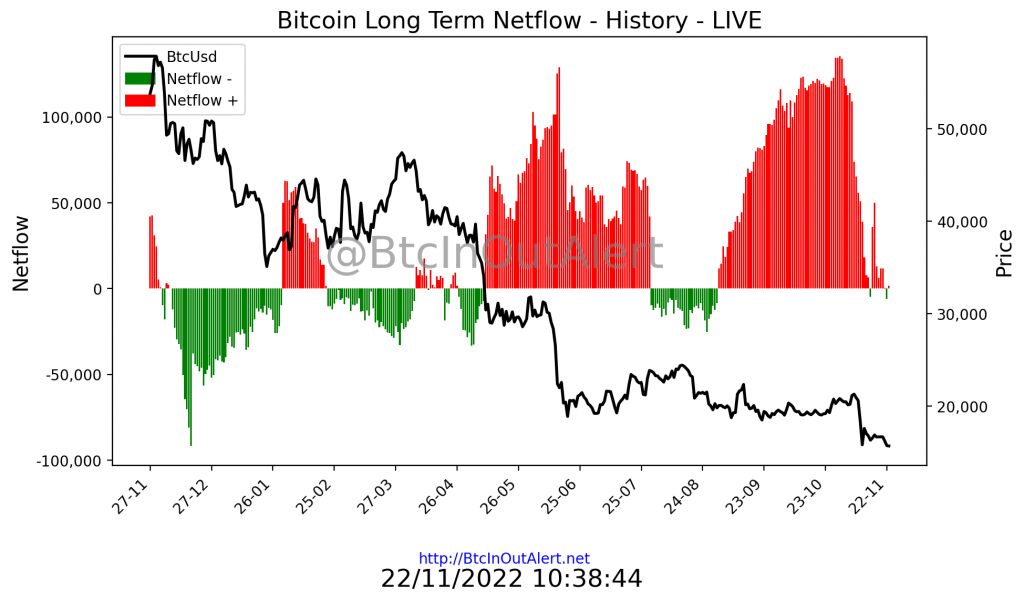
Netflow is an onchain analysis tool that compares price trends with the trend of Bitcoin volumes inflow and outflow of exchanges to study the likelihood of a trend reversal.
Its purpose is also to help traders understand whether a Bitcoin is currently accumulating or distributing. Although it was originally designed for use on Bitcoin, market logic has meant that it finds wide applications in the world of shitcoins, which we will not cover because they are totally irrelevant (the shitcoins)
Thus, Bitcoin accumulation and distribution allows you to interpret the trend and can be used both when a trend is up, to determine the likelihood that it will advance, and when a trend has already clearly manifested itself and you are trying to figure out whether a reversal is imminent or not.
Netflow as an indicator of accumulation and distribution
Netflow is a tool for measuring in Bitcoin the volume in and out of the Exchange, which assesses the cumulative inflow and outflow of Bitcoin from a given Exchange; simply put, it measures the price and volume of Bitcoin to determine whether it is accumulating or distributing.
The indicator also provides information about the strength of a trend. For example, when the price of the asset is rising, but the Netflow indicator is negative this may indicate that the volume of accumulation, and therefore buying, is not strong enough to support the rising price. These circumstances could mean that a price decline is imminent in the short term.
How to use Netflow as an indicator of accumulation and distribution
If the market price is in an upward trend, the indicator will be rising, reflecting buying pressure, while in a downward trend, the indicator will be falling, reflecting selling pressure; if this is not the case, we are in a divergence.
One of the great advantages of this indicator is precisely the issue of divergence. In fact, if the market price is in one direction and the indicator is in the opposite direction, it is usually a very interesting warning that the market may reverse its trend.
Thus, the most reliable signals provided by Netflow, accumulation or distribution, are divergences.
The buy signal will appear with a positive divergence, that is, when the market price is falling but the Netflow is rising. In this case, the analyst should be alert because there is a good chance that the price will soon turn upward.
A bearish divergence sell signal would occur when the market price is rising but the Netflow is falling. In this case, the technical analyst should be alert because there is a good chance that the price will soon turn downward.
Strategy with the indicators of accumulation and distribution
As you now know, the Netflow therefore creates both bullish and bearish signals. These signals are based on divergence and its confirmation.
Although the use of Netflow alone is feasible, it is more advantageous to add other indicators such as Data Volume, Address Distribution, Dormant Address Activity, Long Term and Short Term Holder. They provide additional data and useful ranges to be used to highlight extreme conditions for which Netflow was not designed, although they do so differently.
Conclusions
Netflow is an extremely useful onchain indicator for measuring the cumulative capital flow for a financial asset such as a currency pair (BTC/USD). It is based on both price and volume and can be used as a tool to monitor trend.
Divergences between this indicator and the asset price are usually fairly reliable signals of trend change; they are data that the Blockchain provides us with, public, which employed in conjunction with additional analysis tools can confirm the signals.
External insights
BtcInOutAlert

Other Charts
|
Netflow |
|
Address Distribution |
|
Volume |
|
Other Data |