
This post is a follow-up to the previous post : https://btcinoutalert.net/microstrategy-bitcoin-addresses/
[adinserter name=”CoinAdsenseRotation”]
[adinserter name=”CoinAdsenseRotationMobile”]
On-chain data are interpretive, we have said repeatedly, but the enormous amount of data, public, analyzable remains a unique tool in the modern financial world. In a previous post we identified Bitcoin addresses from MicroStrategy, a Nasdaq-listed company that has abandoned dollar reserves to accumulate Bitcoin. In this post we will analyze a new Bitcoin address traceable to MicroStrategy (MSTR).
After the latest analysis and the almost certain identification of MicroStrategy’s Bitcoin addresses, some users were talking about “possible selling of Bitcoin by MicroStrategy,” a suspicion that actually had no confirmation. The suspicions came from some outflows, such as the outflow of 14,000 Bitcoins to the address 1JHceFenZHACSRPD6tE4bfU6yJ83wTG6kH
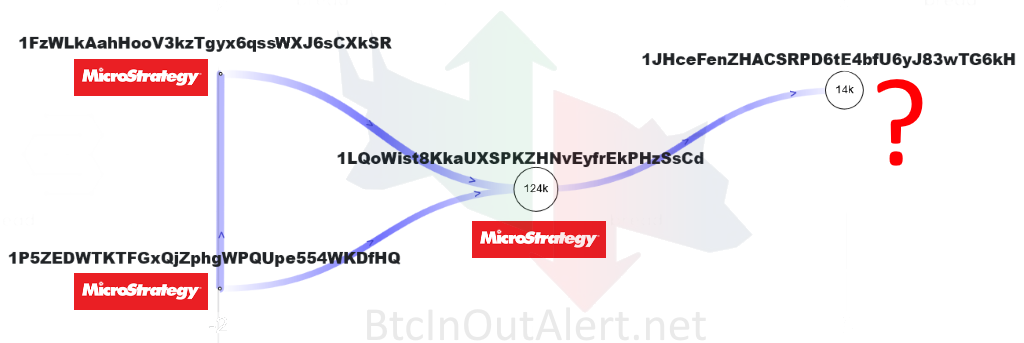
The suspicion was that this address was owned by MicroStrategy, but without proof. Since the last release of Form 8-K (a form used to notify investors in U.S. public companies of specific events that might be important to shareholders or to the U.S. Securities and Exchange Commission) we have been able to identify that address as an additional address traceable to MicroStrategy.
The document mentions :
MicroStrategy, together with its subsidiaries, increased its bitcoin holdings by 2,500 bitcoins,
Source : https://www.microstrategy.com/content/dam/website-assets/collateral/financial-documents/financial-document-archive/form-8-k-12-28-2022.pdf
from approximately 130,000 bitcoins as of October 31, 2022, to approximately 132,500 bitcoins as of December 27, 2022.
Thus, we know that MicroStrategy, as of December 27, 2022, holds about 132,500 Bitcoins.
If, in addition to the addresses we have already identified, we also add up the Bitcoins of the suspect address :
| Address | Balance as of December 27, 2022 |
|---|---|
| 1JHceFenZHACSRPD6tE4bfU6yJ83wTG6kH | 13,816 Bitcoin |
| 1LQoWist8KkaUXSPKZHNvEyfrEkPHzSsCd | 124,348 Bitcoin |
| 1P5ZEDWTKTFGxQjZphgWPQUpe554WKDfHQ | 0 Bitcoin |
| 1FzWLkAahHooV3kzTgyx6qsswXJ6sCXkSR | 0 Bitcoin |
| Total | 138,164 Bitcoin |
We can therefore confirm that the address 1JHceFenZHACSRPD6tE4bfU6yJ83wTG6kH is an address traceable to MicroStrategy.
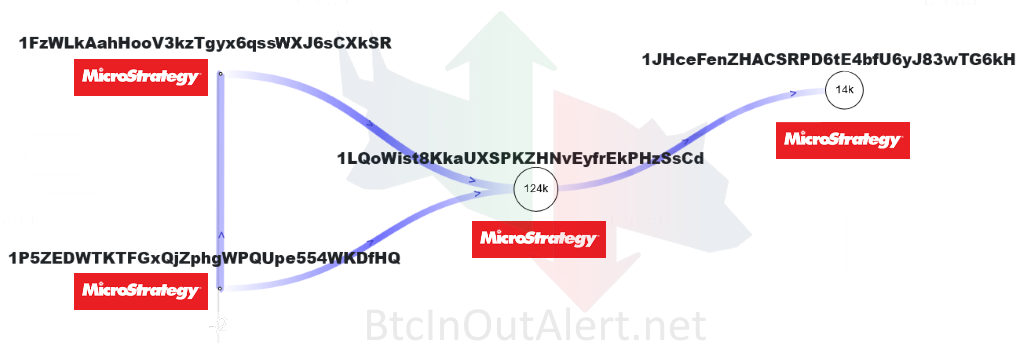
Onchain data embedded with public data has enormous potential for analysis, and this is a classic example.
BtcInOutAlert
Other Charts
|
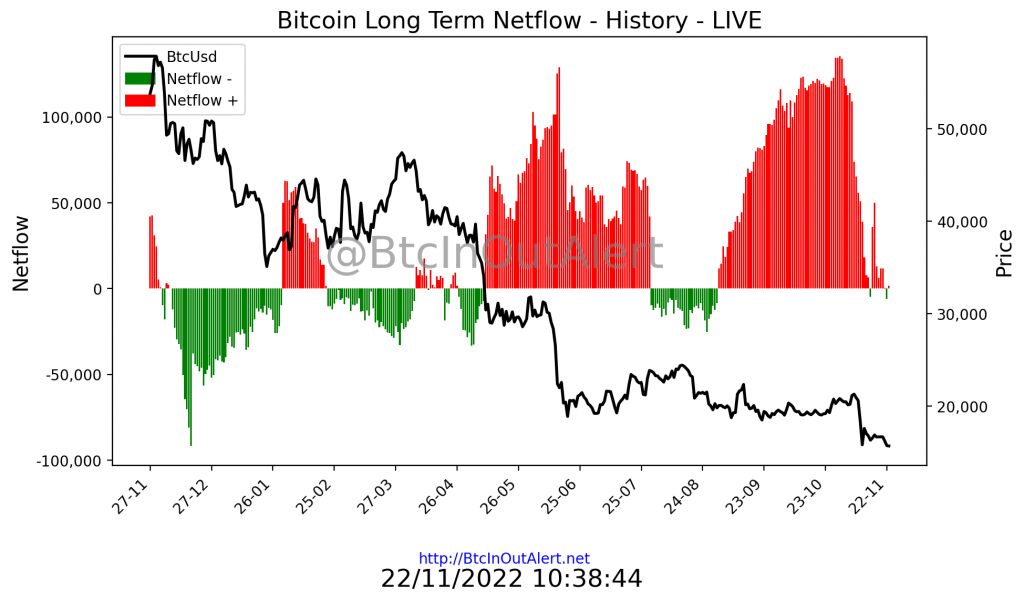
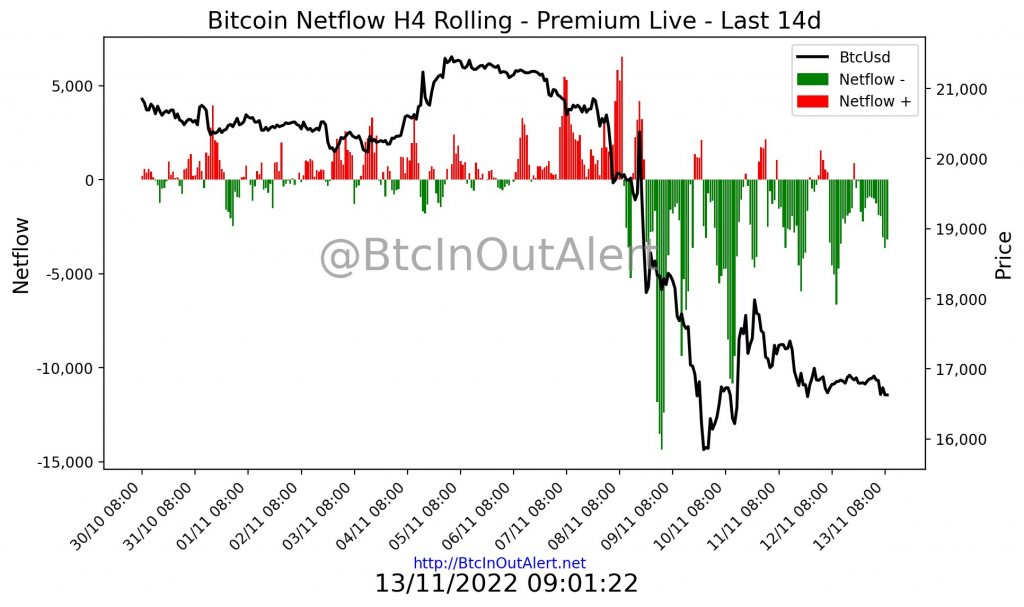
Netflow |
|
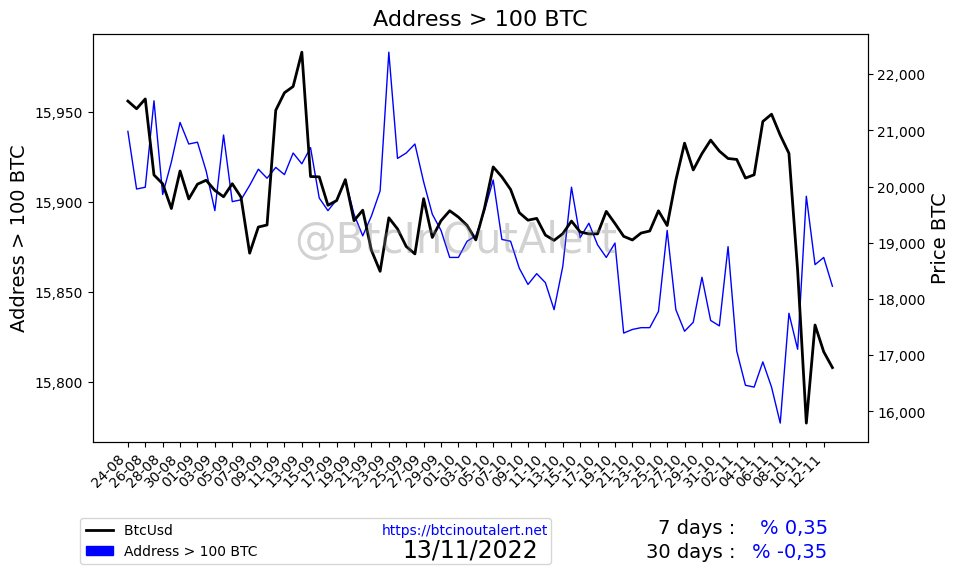
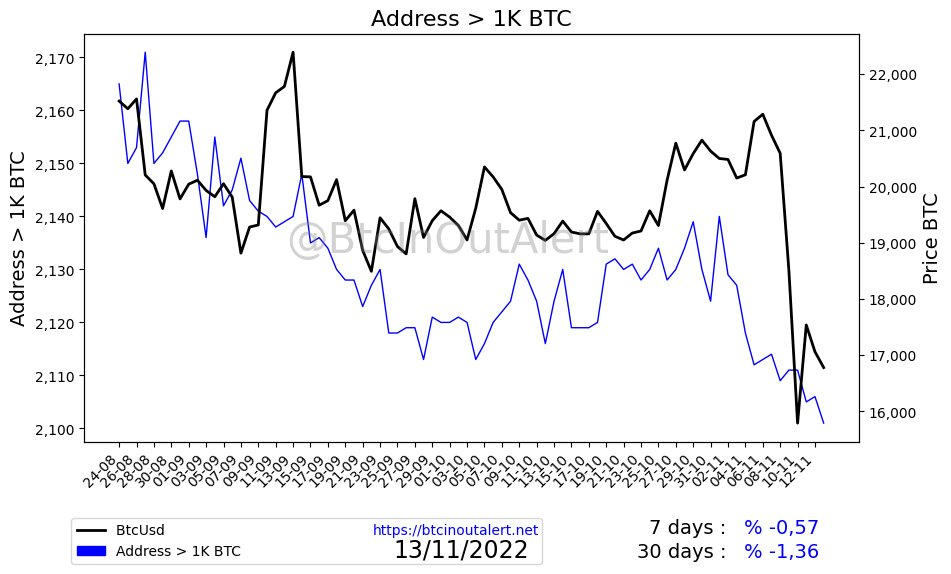
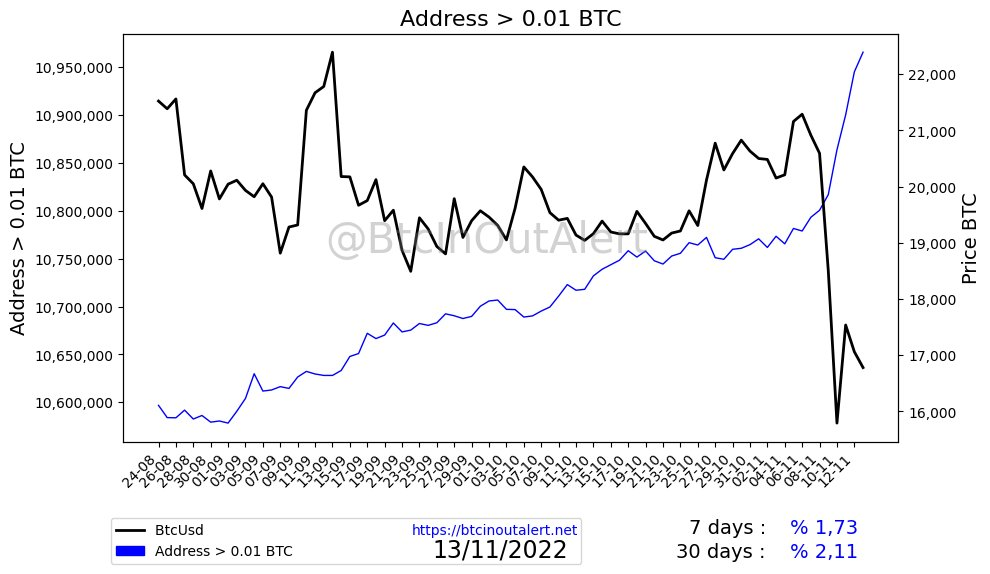
Address Distribution |
|
Volume |
|
Other Data |