Categories
Beginner guides Onchain Analysis

What is Netflow

[adinserter name=”CoinAdsenseRotation”]

[adinserter name=”CoinAdsenseRotationMobile”]

Intro

Onchain data are becoming increasingly important in the Bitcoin world, this is because they are useful in interpreting and often anticipating Bitcoin price movements. We have noticed how there is an openness even from major Exchanges in publishing onchain data (Kraken for example publishes excellent analysis, find the link at the bottom of the page of their analysis).

There are many useful onchain indicators, but today we will focus on Netflow, which is the most natural movement of bitcoin to exchanges, and bitcoin in exchanges are the ones that generate the price for an ordinary person.

What is Netflow

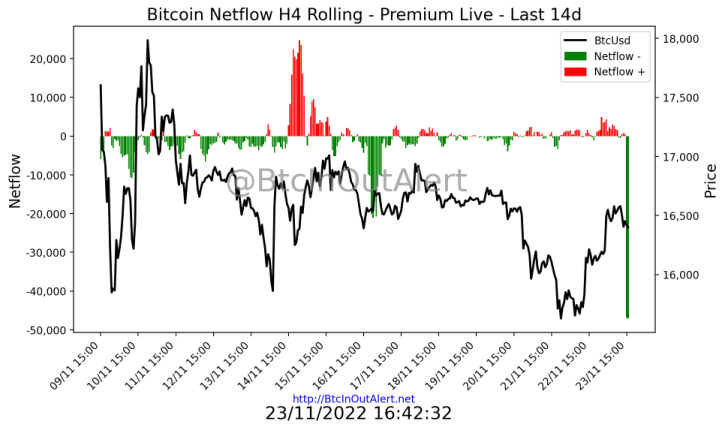
Netflow is an onchain analysis tool that compares price trends with the trend of Bitcoin volumes inflow and outflow of exchanges to study the likelihood of a trend reversal. 
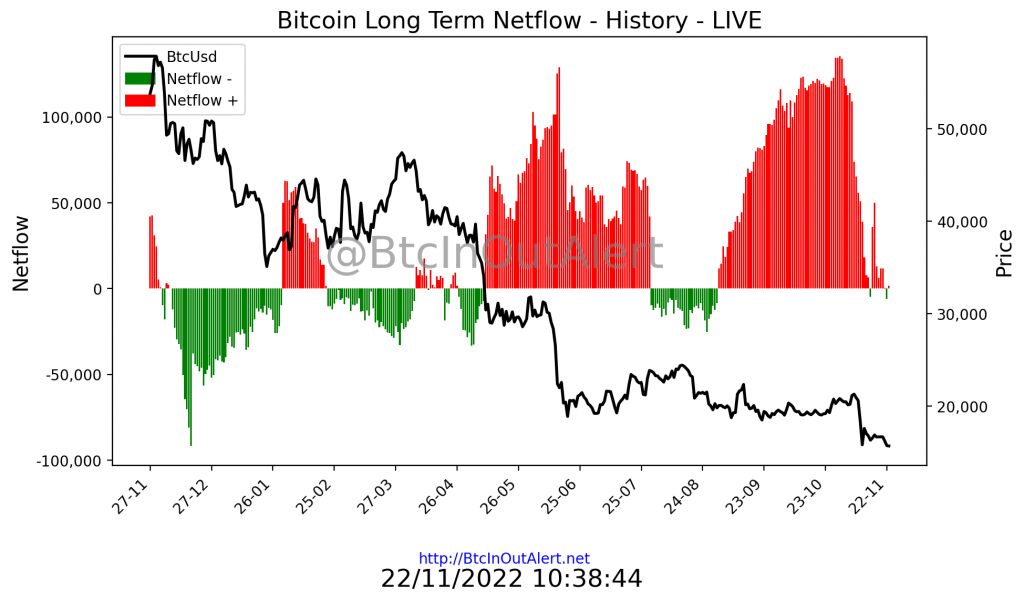
1 year of Netflow. Source : BtcInOutAlert.net

Its purpose is also to help traders understand whether a Bitcoin is currently accumulating or distributing. Although it was originally designed for use on Bitcoin, market logic has meant that it finds wide applications in the world of shitcoins, which we will not cover because they are totally irrelevant (the shitcoins)

Thus, Bitcoin accumulation and distribution allows you to interpret the trend and can be used both when a trend is up, to determine the likelihood that it will advance, and when a trend has already clearly manifested itself and you are trying to figure out whether a reversal is imminent or not.

Netflow as an indicator of accumulation and distribution

Netflow is a tool for measuring in Bitcoin the volume in and out of the Exchange, which assesses the cumulative inflow and outflow of Bitcoin from a given Exchange; simply put, it measures the price and volume of Bitcoin to determine whether it is accumulating or distributing.

The indicator also provides information about the strength of a trend. For example, when the price of the asset is rising, but the Netflow indicator is negative this may indicate that the volume of accumulation, and therefore buying, is not strong enough to support the rising price. These circumstances could mean that a price decline is imminent in the short term.

How to use Netflow as an indicator of accumulation and distribution

If the market price is in an upward trend, the indicator will be rising, reflecting buying pressure, while in a downward trend, the indicator will be falling, reflecting selling pressure; if this is not the case, we are in a divergence.

One of the great advantages of this indicator is precisely the issue of divergence. In fact, if the market price is in one direction and the indicator is in the opposite direction, it is usually a very interesting warning that the market may reverse its trend.

Thus, the most reliable signals provided by Netflow, accumulation or distribution, are divergences.

The buy signal will appear with a positive divergence, that is, when the market price is falling but the Netflow is rising. In this case, the analyst should be alert because there is a good chance that the price will soon turn upward.

A bearish divergence sell signal would occur when the market price is rising but the Netflow is falling. In this case, the technical analyst should be alert because there is a good chance that the price will soon turn downward.

Strategy with the indicators of accumulation and distribution

As you now know, the Netflow therefore creates both bullish and bearish signals. These signals are based on divergence and its confirmation.

Although the use of Netflow alone is feasible, it is more advantageous to add other indicators such as Data Volume, Address Distribution, Dormant Address Activity, Long Term and Short Term Holder. They provide additional data and useful ranges to be used to highlight extreme conditions for which Netflow was not designed, although they do so differently.

Conclusions

Netflow is an extremely useful onchain indicator for measuring the cumulative capital flow for a financial asset such as a currency pair (BTC/USD). It is based on both price and volume and can be used as a tool to monitor trend.

Divergences between this indicator and the asset price are usually fairly reliable signals of trend change; they are data that the Blockchain provides us with, public, which employed in conjunction with additional analysis tools can confirm the signals.

External insights

  1. Kraken Onchain Analysis

BtcInOutAlert


Other Charts

Netflow

Address Distribution

Volume

Other Data


Latest Insights and Info

Categories
Beginner guides Onchain Analysis Service info

What is Bitcoin address distribution

[adinserter name=”CoinAdsenseRotationMobile”]

[adinserter name=”CoinAdsenseRotation”]

After a short guide on What is Netflow, if you haven’t read it we recommend you do since it gives you the minimum logical foundation on what Netflow is and how to interpret it, today we will focus on another valuable metric : the Distribution of Bitcoin addresses.

All present charts you will find on BtcInOutAlert.

Address distribution is one of the useful metrics in near crypto price prediction through onchain analysis. It is easy to read, within anyone’s reach, and it is objective data; all the data is in Blockchain, and even through its history, it is possible for anyone to do an analysis for crypto price prediction.

Our charts are divided as:

Chart
Address non-Zero
Addresses with a balance > 0.01 â‚¿
Addresses with a balance > 0.1 â‚¿
Addresses with a balance > 1 â‚¿
Addresses with a balance > 10 â‚¿
Addresses with a balance > 100 â‚¿
Addresses with a balance > 1,000 â‚¿
Addresses with a balance > 10,000 â‚¿
Addresses with a balance > 100,000 â‚¿
List of address distribution charts

As you can see by viewing our Bitcoin address distribution charts, there are clear disparities between increase and decrease based on quantity. Let us analyze the extremes to understand who and how they are increasing and/or decreasing their balances.

Increasing Bitcoin addresses

Right now on the rise we have two absolute metrics, namely the very small ones and the very large ones. Below you can see addresses greater than 0.1 Bitcoin (at current exchange rate $1650) and addresses greater than 10,000 Bitcoin.

Addresses above 10,000, as we have already previously analyzed in the post “Accumulation in progress?” are almost all addresses that can be traced back to exchanges, confiscated or old addresses that have been stopped for many years, so even if they are increasing they cannot be considered accumulations, far from it, they are often Bitcoin that enter exchanges to be sold and/or exchanged for other currencies.

Addresses above 0.1 Bitcoin although considered accumulations must be kept in mind that, especially in recent weeks, there has been a massive outflow from centralized exchanges the result of user distrust after the failure of FTX, but we can consider the metric in accumulation.

Decreasing Bitcoin addresses

Now let us analyze the extremes on the side of degrowth :

As can be seen there is a slight decrease in addresses above 100 and 1,000 Bitcoin, a decrease significantly lower than the percentages of over 5 percent of 0.1 Bitcoin addresses.

So the question is, who is increasing and who is decreasing their Bitcoin reserves? The answer is quite clear, small addresses increased exponentially, while large addresses lightened their reserves.

What often escapes notice, however, is the weight that metrics have; bitcoin accumulated by small wallet are by far smaller amounts than those issued by big wallet.

If we also try to do a very rough sum, we will notice that the weight of the two distributions are totally different. A decrease of 1.60% has a much greater weight than the 5% increase in addresses above 0.1 Bitcoin.

This is an important element to understand for proper analysis. Data must be seen and read as a whole, and each metric must be given the correct weight, otherwise the risk is to make errors in analysis.

Conclusions

This post is only meant to pose evidences that will hopefully be useful to you in the future for a better reading of the data. As always, it’s up to you to do the final analysis, and these values are very important data that cannot be missed in an analyst’s data set.

Our role is to provide data, and BtcInOutAlert publishes daily updates of distribution metrics; the update occurs within minutes of the daily close. Support us by sharing our link.


Other Charts

Netflow

Address Distribution

Volume

Other Data


Latest Insights and Info

Categories
Onchain Analysis

2 billion was moved at a cost of $0.42

[adinserter name=”CoinAdsenseRotationMobile”]

[adinserter name=”CoinAdsenseRotation”]

Relax, CZ is not running away with all the funds, it is a hack of it, it probably can happen but it is not this time!

The movement of Binance that occurred this morning of November 28 is what can generally be called an internal movement. This can occur for various reasons, which can be fund management, security, or change of procedures, a reorganization of funds (which seems to us the most likely), this is common for an exchange and should not alarm. At the same time it does not stand for an accumulation, it does not indicate a hack or anything else.

TX : https://mempool.space/tx/a2df8acfab675fed1ad1b97e9dbef8d259510315ffb651c0c1de1bdff4a7730e

It is obvious that such a major movement generates alertness, and on this the exchanges should make an effort to avoid alarming users. All it would take is for an exchange to warn with a tweet a few minutes beforehand, and unnecessary controversy and alarm would be avoided.

The only really noteworthy news in all this hubbub is what has escaped almost all users and/or analysts, namely the transaction cost, the fees paid.

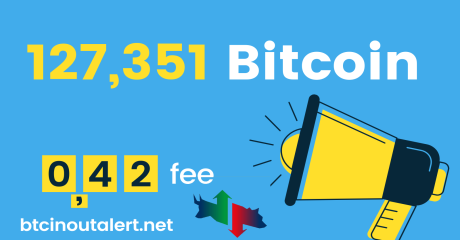
2 billion was moved at a cost of $0.42, don’t you find that interesting? 🙂

Bitcoin is still alive!

Thank you Satoshi


Other Charts

Netflow

Address Distribution

Volume

Other Data


Latest Insights and Info

Categories
Onchain Analysis

CoinBase 47,348 Bitcoin Outflow?

[adinserter name=”CoinAdsenseRotation”]

[adinserter name=”CoinAdsenseRotationMobile”]

If you are immediately looking for the answer to the question in the post, the answer is NO. It is not an outflow and we explain why, but more importantly we explain something more important, which is how it uses CoinBase addresses and how it executes transactions on the Blockchain.

What just happened today, an outflow movement of 47,348 Bitcoin, divided into 4 transactions of 11,837 Bitcoin, is the classic example that can perfectly represent how CoinBase transactions.

The onchain data would show this, which is a mega outflow :

when in fact it is a classic internal movement, i.e. moving from CoinBase addresses to other addresses also owned by CoinBase.

Now, first we will show you a classic Binance move, where all sending and receiving addresses are easily tracked even for the average user, and it will be helpful for us to understand the differences between CoinBase and most other exchanges.


Link Graph: https://explorer.bitquery.io/bitcoin/address/3LYJfcfHPXYJreMsASk2jkn69LWEYKzexb/graph

In the last section of the previous chart, you find represented the movement of over 127,000 Bitcoins that occurred on November 18; as you can see, both the history of previous transactions and the latest movement is clear, readable, each address is easily identifiable and assignable to an entity, in this case Binance. The user, even a user with average analytical skills, can easily identify the funds, know how many there are and where they are, at any time. In addition, previously known addresses are reused; this simplifies the analysts’ job since you already know for sure they are owned by Binance.

We now show you only a part of the latest CoinBase movement, that is, only 1 of 4 transactions of 11,837 for a total of 47,348 occurred on November 23.

https://explorer.bitquery.io/bitcoin/address/12Gjyd3MMR7Dj2KwCxw71wwzZXVp2xy8nK/graph

From the CoinBase address 12Gjyd3MMR7Dj2KwCxw71wwzZXVp2xy8nK all funds were moved to a virgin address 1D1SwsCBpifHSefJUo4BD8bYMvWRbH9mzz, subsequently divided into 111 addresses, and again distributed and divided into 10 addresses.

Now, this is just one movement of the 4 addresses, you just have to multiply everything by 4 🙂

BtcInOutAlert, 23 November 2022

Other Charts

Netflow

Address Distribution

Volume

Other Data

Latest Insights and Info

Categories
Onchain Analysis

What happens to the Binance BTC-B Bitcoin wallet?

[adinserter name=”CoinAdsenseRotation”]

[adinserter name=”CoinAdsenseRotationMobile”]

As is always the case, large amounts of bitcoin on the chain create extreme excitement, euphoria or panic, even more extreme excitement when the movement occurs from one of the addresses owned by larger exchanges: Binance.

Big movements from Binance Wallet

During the early hours of November 18, 2022 , from the address traceable to Binance dedicated to the BTC-B peg 3LYJfcfHPXYJreMsASk2jkn69LWEYKzexb various movements to and from, through multiple addresses all traceable to Binance are reported.

It is important to know up front that all movements are zero-sum, meaning that the same amount of Bitcoin is in Binance wallets both before and after the movements.

The certainty that the wallet is traceable to Binance and dedicated to the BTC-B peg comes directly from the owner of the address according to several sources :

What is BTC-B and how does it work?

According to Binance’s own definition, BTC-B is :

Bitcoin BEP2 (BTCB) is a token on Binance Chain issued by Binance, where the price is pegged to BTC at a rate of 1 BTCB = 1 BTC. BTCB is 100% backed by the same amount of BTC in our public reserve address below.

Binance Press Release

and again :

The main benefit of offering crypto-pegged tokens is that, obviously, this makes available to Binance DEX traders the many coins that have their own blockchains and aren’t native on BNB Chain.

Binance Press Release

Simply put, Binance stores Bitcoin reserves in a dedicated address, verifiable address to ensure liquidity on its chain.

Bitcoin Binance reserves track liquidity. The more liquidity on the Binance chain, the more Bitcoin reserves are held in reserves.

Will the Bitcoin removed from liquidity be SOLD at market?

This question will not be answered, but you will give yourself an answer, and the whole thing is based on logic. To give you an answer you first need to understand how liquidity works on the Binance chain, and again we quote Binance’s words :

This provides an easy way for anyone to convert from the pegged token back into the native coin on Binance.com. If this buy order is filled, a new order will be placed while an equal amount of funds will be deposited from the reserve address into Binance.com. The sum of the buy order and the funds on the published reserve address will be bigger than the total supply of the pegged token, ensuring there is always 100% backing.

If those Bitcoin were subtracted from the reserves of the Binance BTC-B address this is a consequence of liquidity leaving the Binance chain, not the other way around. If there is less liquidity on the Binance chain less Bitcoin are needed as collateral, not the other way around.

Is this liquidity outflow bullish or bearish?

This Bitcoin liquidity coming out of the BTC-B reserve addresses are neither bearish nor bullish, but reflect what on the Binance chain HAS ALREADY HAPPENED.

The fear instilled by some people is a very sad story!

BtcInOutAlert, 18 November 2022

Other Charts

Netflow

Address Distribution

Volume

Other Data

Latest Insights and Info

Categories
Onchain Analysis

50 dormant Bitcoin from 2013 moved

A dormant address from 2013 has just been moved.

As we can see from the dormant address chart, 50 dormant bitcoin were moved today.

The group consists of 5 addresses, with transactions forwarded to the same destination address : bc1q0v4vcvhur73cr66p28llf2q3juyendlmk9ypjz

13bxmdWrbJmCBKzjTs4zFgLjkwQMLiTdqv
1Ctt7i8a5pZwzD2kveg1FDXG8UarCU2o5k
14WVnBjVb7VDRmHkeDkjjCTTrp1cmVjaTJ
1GB34hQerTmgvxtQJ6HQ5krKqE48FRXw3w
19mza6aKvTGgSauTuWwTeFcphfbwYtTqq1

You can follow the updated charts in the All Data section

BtcInOutAlert

17 November 2022

Other Charts

Netflow

Address Distribution

Volume

Other Data

Latest Insights and Info

Categories
Onchain Analysis

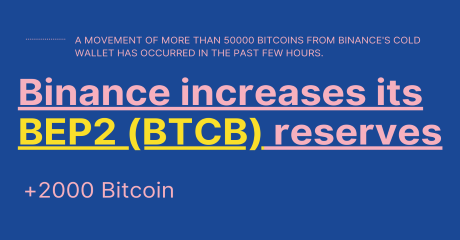
Binance increases its BEP2 (BTCB) reserves

A movement of more than 50000 bitcoins from Binance’s Cold Wallet has occurred in the past few hours.
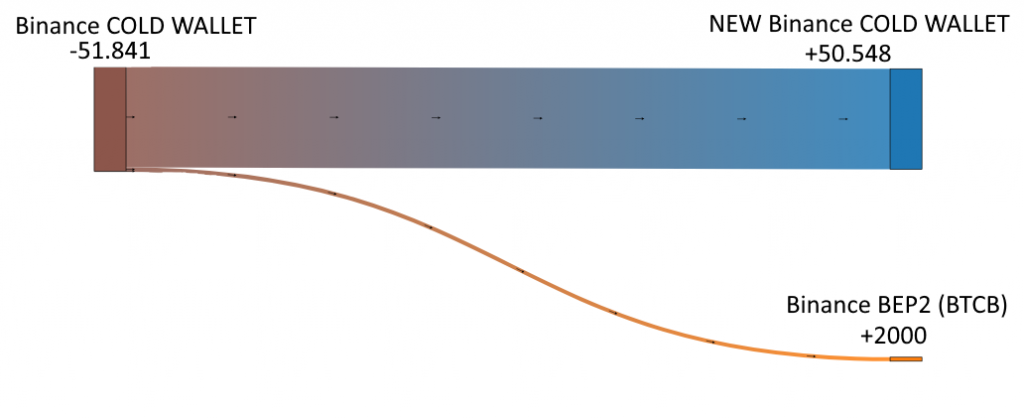
The movement was necessary to increase the balance sheet balances and reserves of the Binance BEP2 Wallet (BTCB).

As can be seen from the image, the number of bitcoins exited from the binance cold wallet is 2000, including 1293 from the main cold wallet, plus 707 from secondary Binance addresses

Source : Bitquery.io screenshot

Other Charts

Netflow

Address Distribution

Volume

Other Data

Latest Insights and Info

Categories
Onchain Analysis

6522 dormant Bitcoin from 2017 moved

A dormant address from 2017 has just been moved.

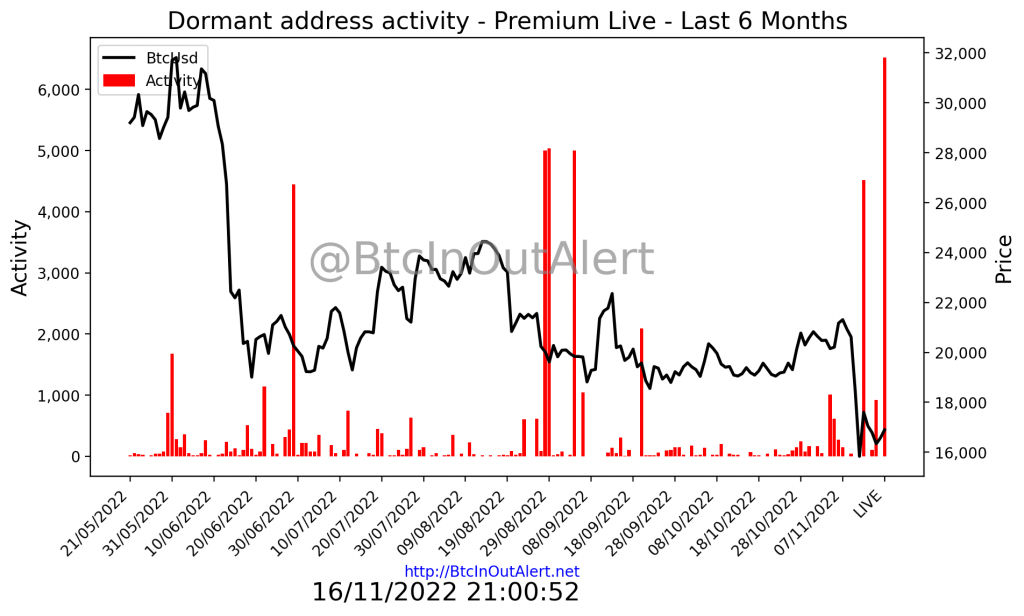
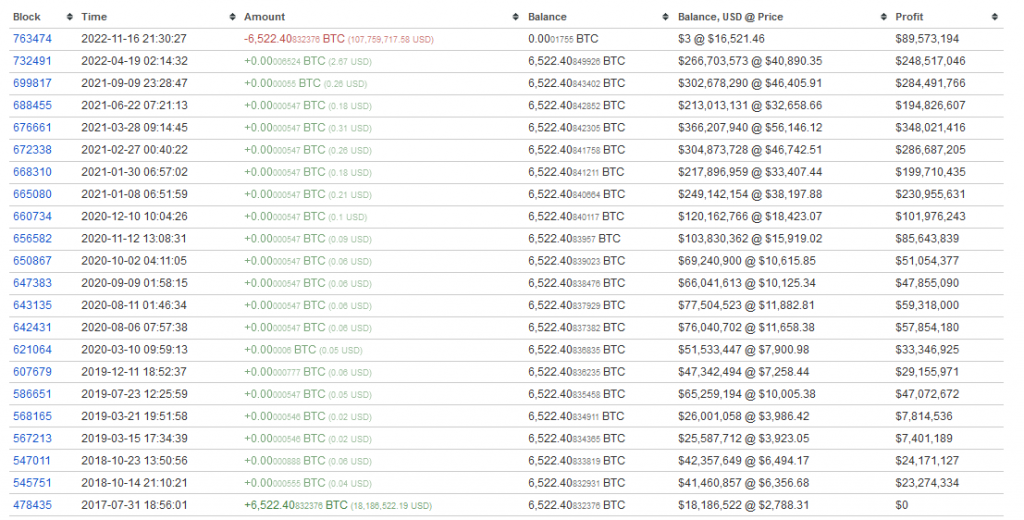
As we can see from the dormant address chart, 6522 dormant bitcoin were moved today. It is among the most important movements in the last 3 months, and it is one of the most important movements in a single transaction and single address.

Source screenshot : Bitinfocharst.com

The address is : 1LB8BHdaRjeRsxz8SqiAFFQLjXkzCKsgvX

BtcInOutAlert

16 November 2022

Other Charts
Netflow

Address Distribution

Volume

Other Data

Latest Insights and Info

Categories
Onchain Analysis

50 bitcoin mined in 2010 moved

A dormant address from 2010 has just been moved.

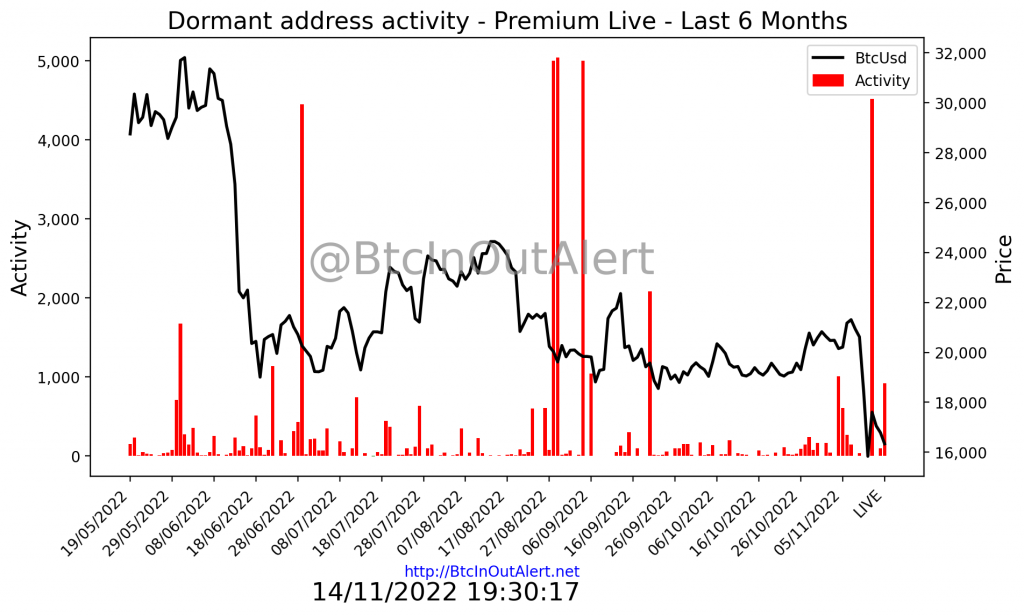
As we can see from the dormant address chart, 1000 dormant bitcoins were moved today.

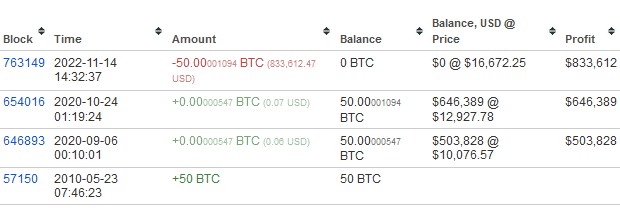
Among these 1,000 bitcoins, 50 caught the eye. These 50 bitcoins have been standing still since May 2010, more than 12 years.

These bitcoins have been mined and have no previous history, until now.

Source screenshot : Bitinfocharst.com

The address is : 1LB8BHdaRjeRsxz8SqiAFFQLjXkzCKsgvX

The transaction was sent to a temporary address, and then to an address containing 25 bitcoin on June 23, 2022, a sign that it is most likely an entity that purchased over the counter (OTC, off exchanges or with exchanges acting as a middleman); these are typical movements of entities, small or large, that accumulate over the long term.

Bitcoin that have no previous transaction history are very attractive to institutional entities, banks, states, companies, this is because it frees them from any possibility of abnormal transactions. Generally these bitcoin have different prices, often higher than market prices.

This transaction does not currently appear to be sent to a known exchange address.

BtcInOutAlert

14 November 2022

Other Charts

Netflow

Address Distribution

Volume

Other Data

Latest Insights and Info

Categories
Onchain Analysis

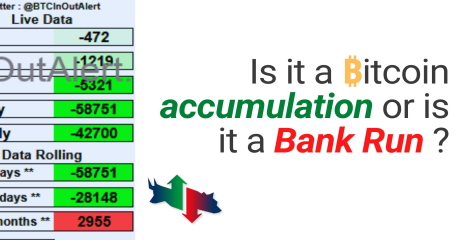
Is it a Bitcoin accumulation or is it a Bank Run ?

Is it a real BTC accumulation or is it a rush to withdraw the money ?

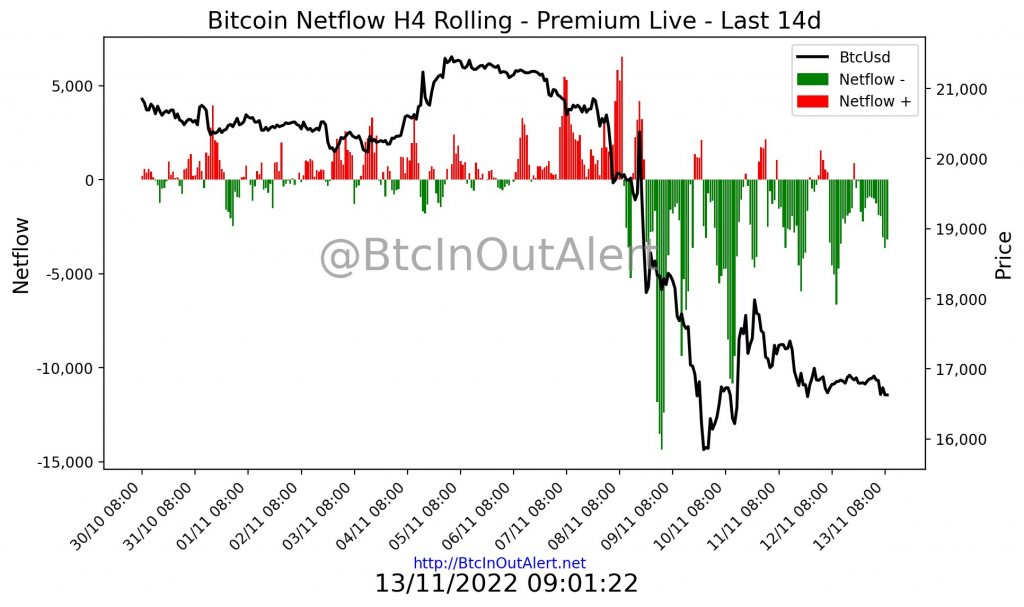
November 13, 2022 More than 58,000 Bitcoin have gone out in the past 7 days, one of the weeks with the highest number of bitcoin gone out. Outflows not seen in many months.

Bitcoin Netflow Report – 13/November/2022 09:27 UTC

The 4H rolling graph shows an exponential increase in outflows as soon as the rush to exit FTX began.

Bitcoin Netflow H4 Rolling – 13/November/2022 09:01 UTC

A great help comes to us from Onchain data in its completeness Historically, addresses over 100 and 1K Bitcoin are from large funds and Big investors.

Both have been declining for the last 30 days, and in the last week there has been no increase

Addresses greater than 100 Bitcoin
Addresses greater than 1k Bitcoin

In opposite, very small portfolios are in vertical increase Use your head, make your own assessments, use our free and independent data.

Other Charts

Netflow

Address Distribution

Volume

Other Data

Latest Insights and Info